Modeling Home Sale Prices in Philadelphia
Lab 3: Midterm
Shuarya Chauhan, Indrajeet Chavan, Vedika Jawa, and Wil Rantala
2026-03-17
Predicting Philly Housing Prices
Why?
- Planners may use predictions to evaluate the impact of new transit developments, zoning changes, or parks on property values and affordability
- Helps justify public investment by giving a dollar value to neighborhood amenities
- Helps to understand urban sociological shifts and demographic changes
- Accurate home valuation for property taxes
How?
- Publicly available data
- Using R, a free statistical software
Data Sources
Property Sales from 2023-2024
- Cleaned to only include residential properties sold above $10000 (n = 27792)
- Including home-level data such as square footage, bedrooms, and building type
ACS 5-year 2023 data at the Block Group level
- Including Population, Median Income, Poverty, Educational Attainment, Employment, and Owner Occupancy Demographic Data
Google Maps
- Philadelphia City Hall Location
Data Sources Contd.
OpenDataPhilly
- Philadelphia Parks and Recreation (PPR) properties for park locations
- SEPTA Bus and Trolley stop locations
- Schools, Hospitals, Restuarants, and Crime Incidents Locations
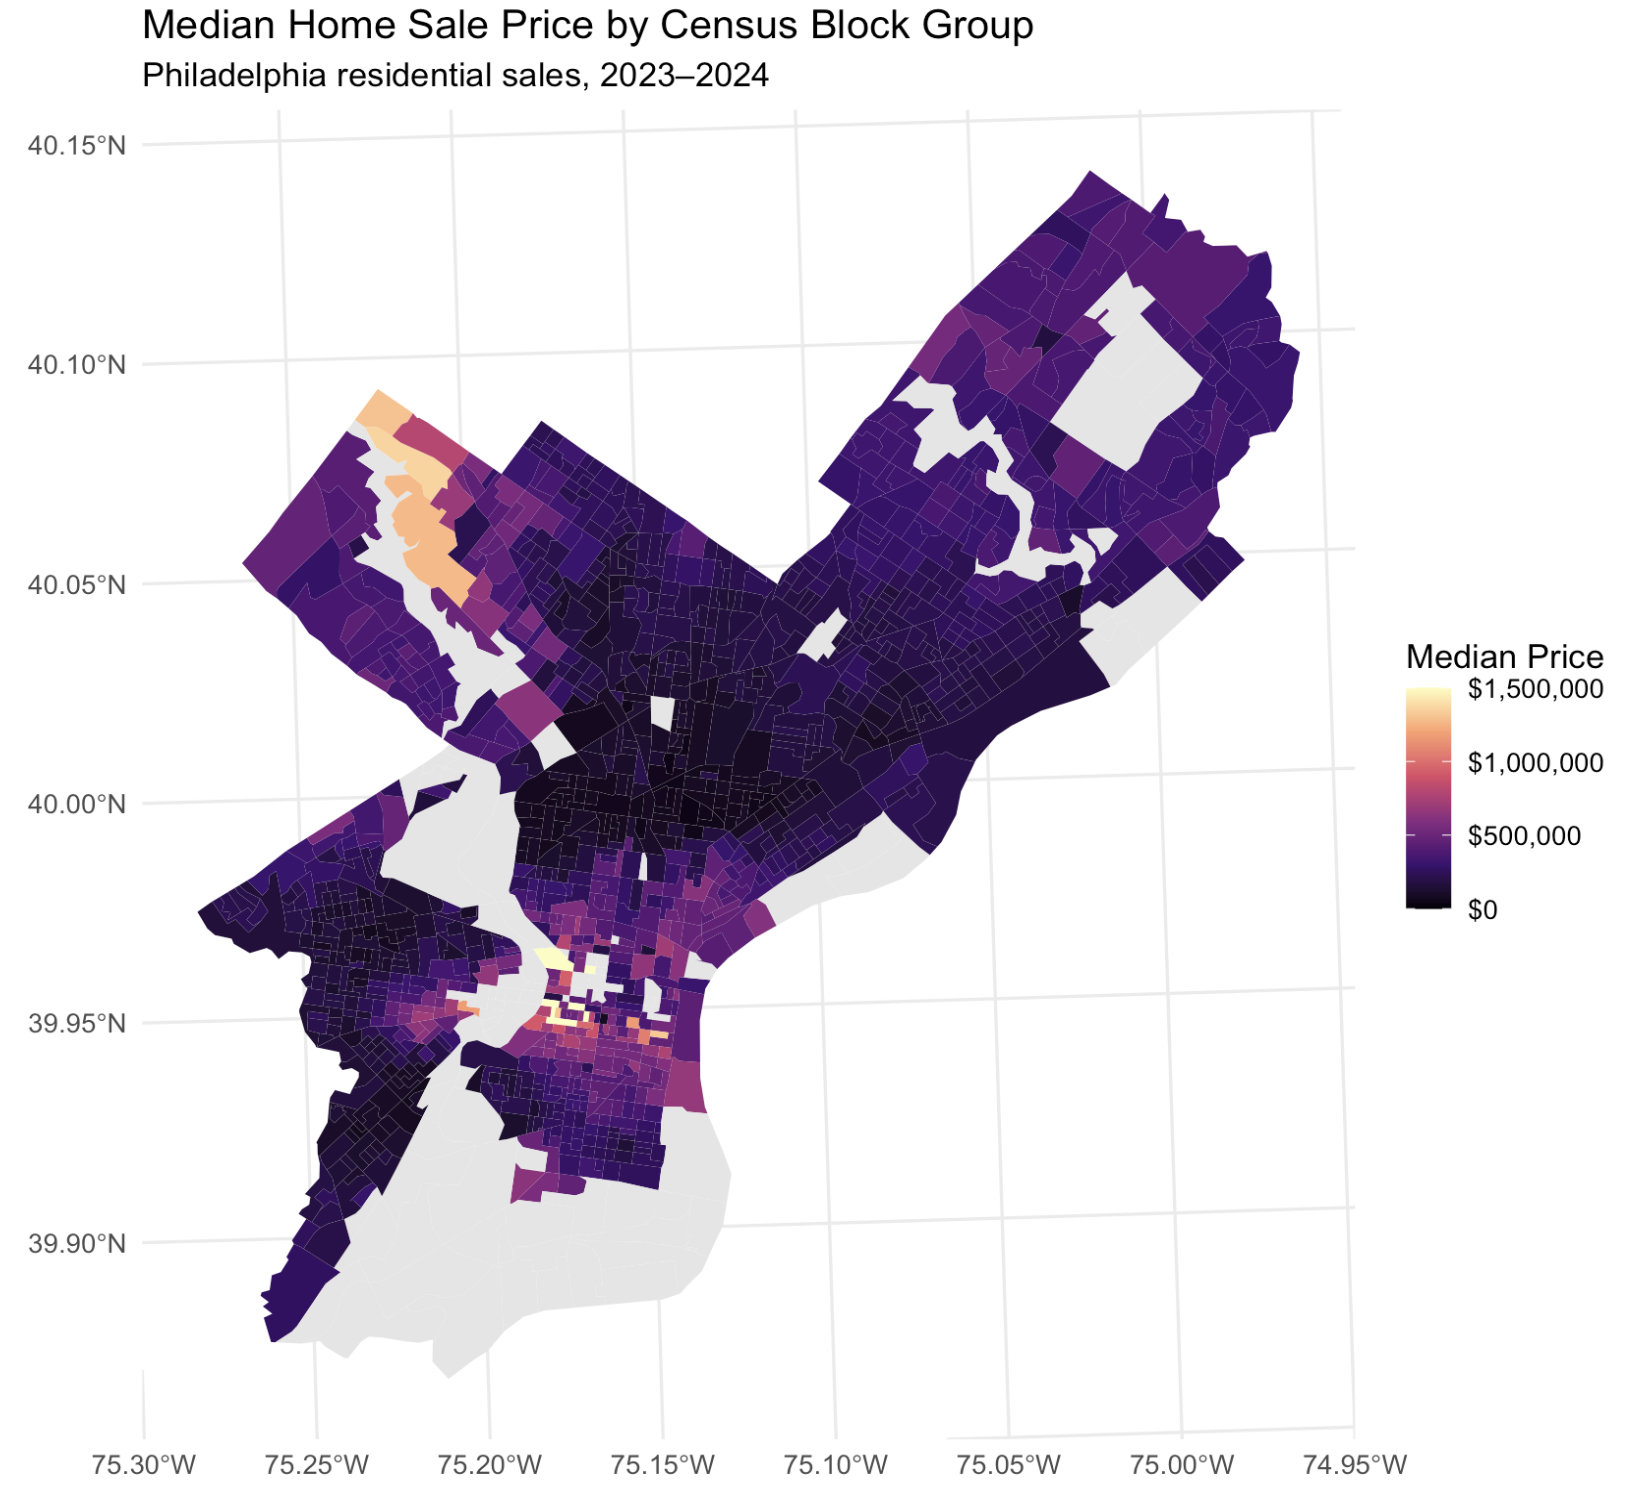
Where are the Expensive Homes?
![]()
Center City and Northwest Philly have many of the highest prices, with some areas having median sale values in the $ millions
Northeast Philly has median sale prices in the ~$500,000 range
Higher Values in West Philly are concentrated near University City
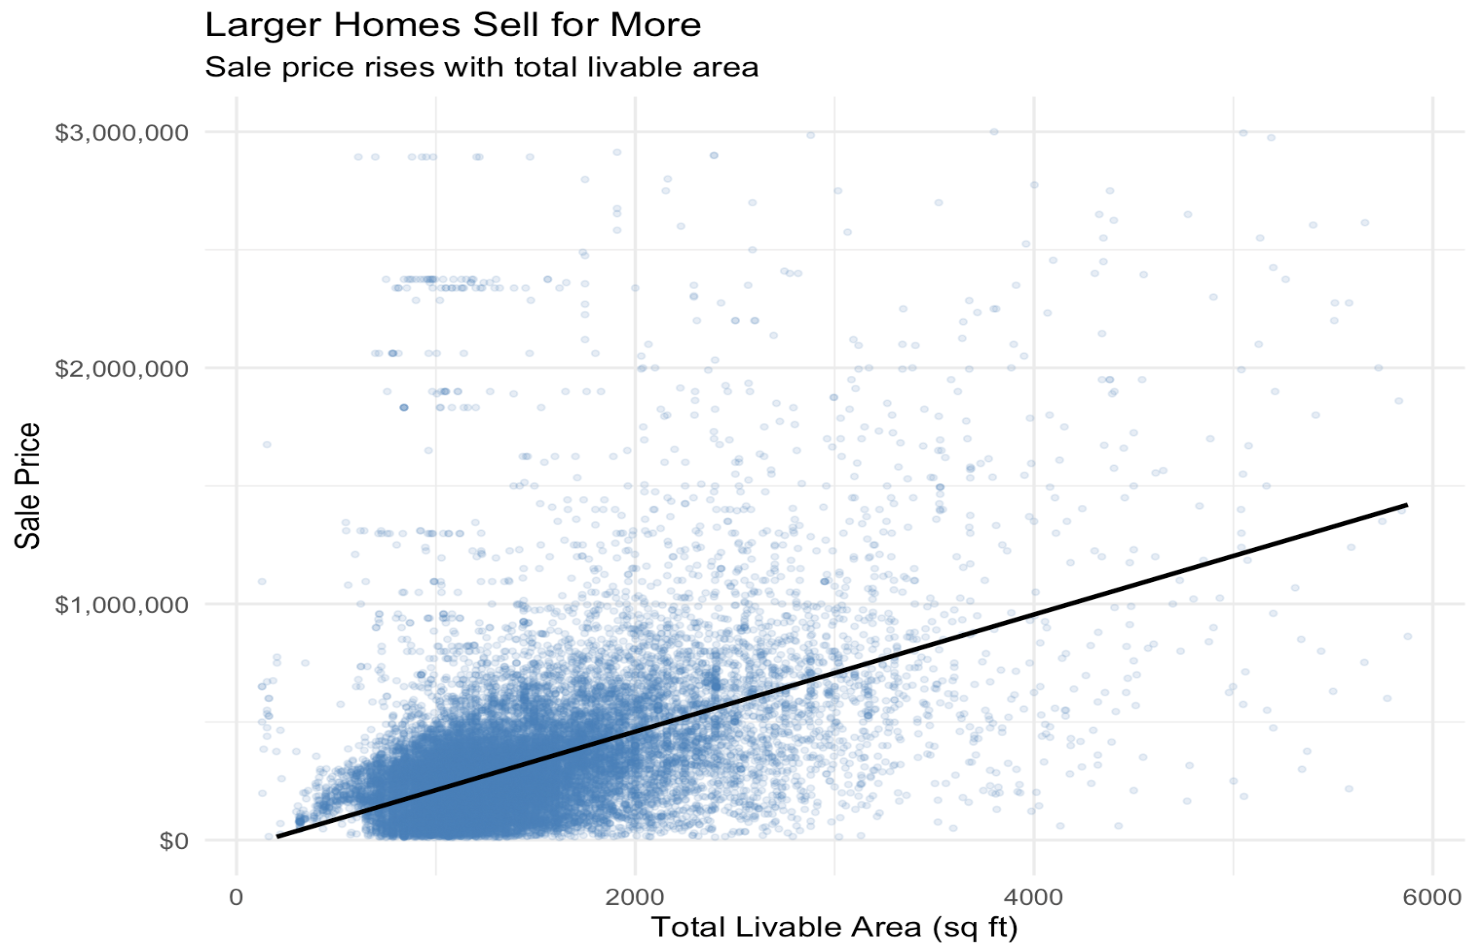
What Drives Prices?
![]()
Living Area has a powerful positive correlation with home sale price
In preliminary data analysis, living space came out as a key driver of housing prices
In our actual models, we use the natural log of sale price to achieve a more normal distribution
Model Creation
We made four models, each progressively more complex with varying predictive data types
Model 1: Spatial Data
Model 2: Structural and Census Data
Model 3: Structural, Census, and Spatial Data
Model 4: Structural, Census, Spatial, and Fixed Effect Data
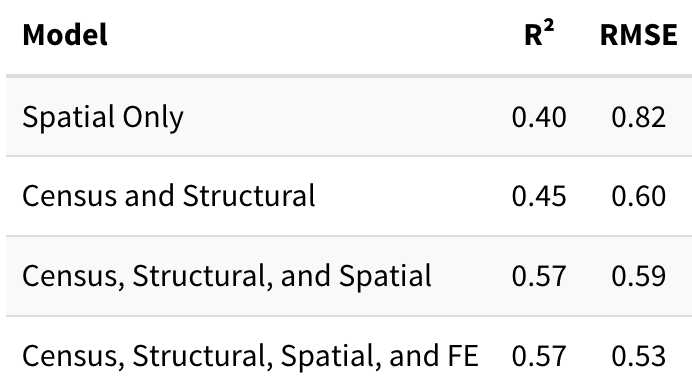
Model Comparison
![]()
- Spatial Data on its own is a powerful predictor
- Adding a fixed effect component to the model helped to improve predictive power – not model fit
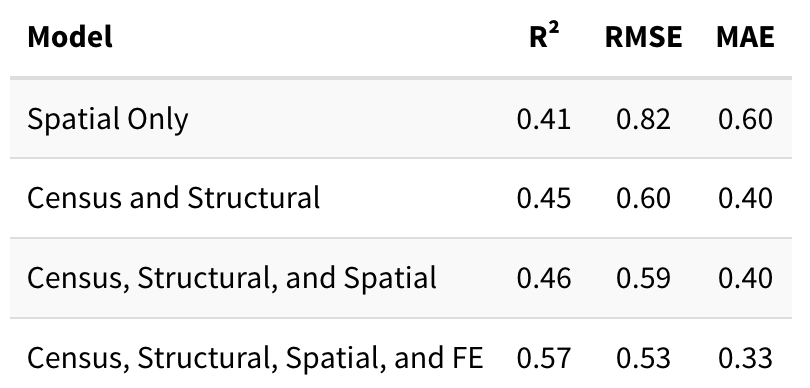
Cross Validation Results
![]()
- Model 4 has the strongest predictive ability with the lowest RMSE and MAE, and the highest R^2
Key Findings & Recommendations
Model Accuracy: RMSE = 0.53
Top Predictors:
- Total Livable Area (coef = 0.0003; p < 2e-16)
- Median Income (coef = 0.000001; p < 2e-06)
- Crime Density (coef = -0.00005; p < 0.0002)
Worst Predictor:
- Distance to Transit (coef = 0.000007; p = 0.61)
Key Findings & Recommendations
Recommendations:
Comprehensive neighborhood investment (not just focusing transit, green space, or crime)
Including interaction terms of spatial variables and income could be key improvements it may matter more in high/low income neighborhoods
Importance of distance to transit varies greatly in neighborhoods depending on their demographics and other spatial features
Census Tracts of NE Philly were difficult to predict
Limitations & Next Steps
Limitations and Concerns
Multicollinearity
Variables as Proxies (e.g. crime density is dependent on police activity and arrests)
ACS margins of error (espacially at the block level)
Temporal restraint (applicable for other years?)
Next Steps
Interaction models with transit and other variables to understand verying relationships
Better distance metrics (walking/driving times)
Additional data (environmental threats, school quality)